This App Got Us 1st Place at a Microsoft Hackathon
A 24-hour Microsoft Azure hackathon where we tackled road potholes, a $6.4 billion infrastructure problem. Phone telemetry, computer vision, and a minimal interface that helped us take first place.
The Challenge
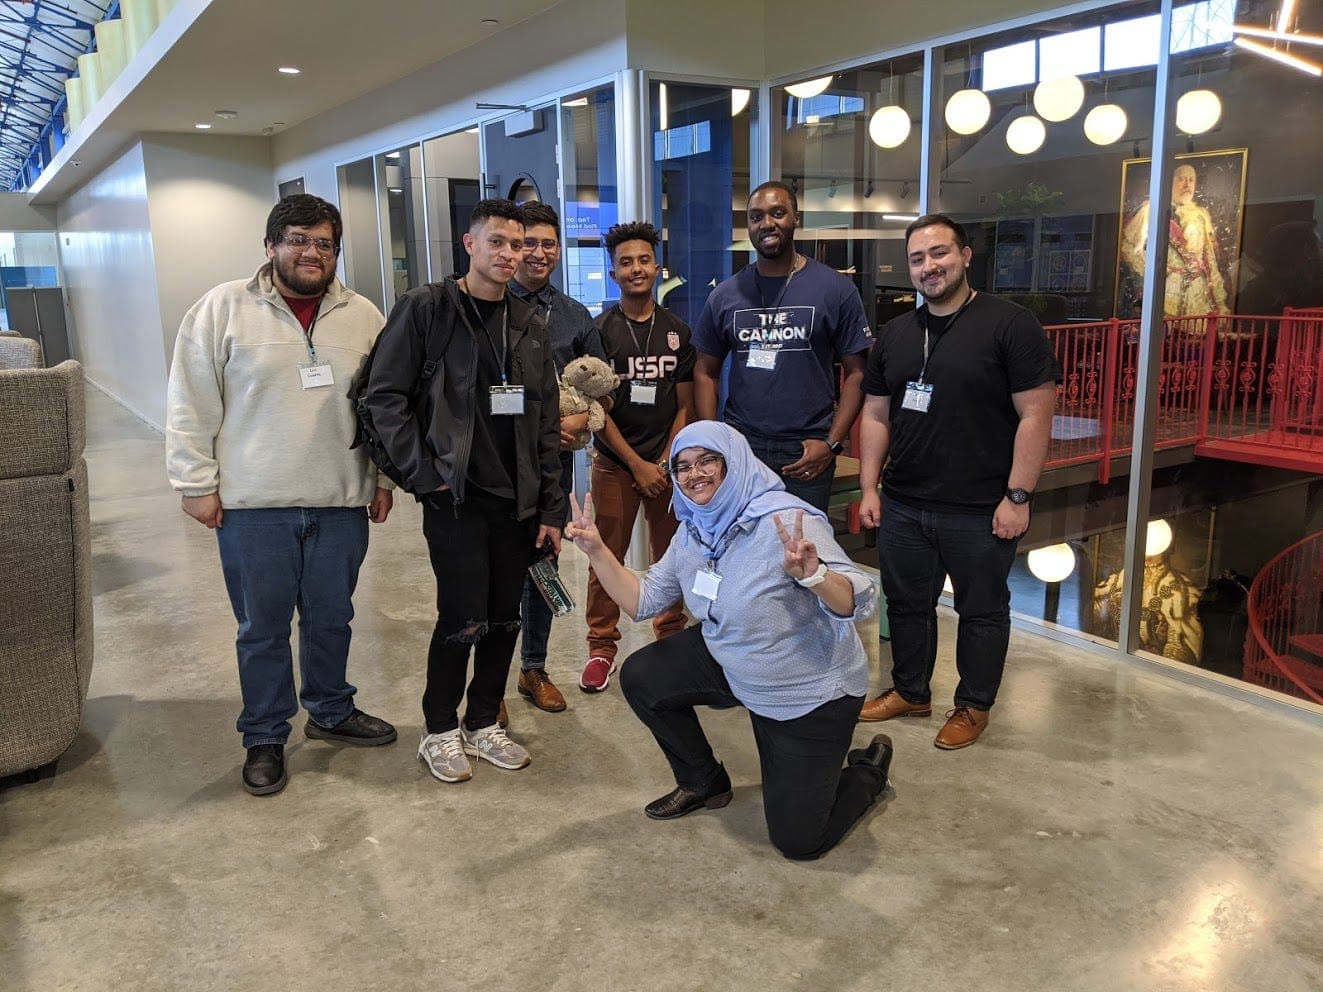
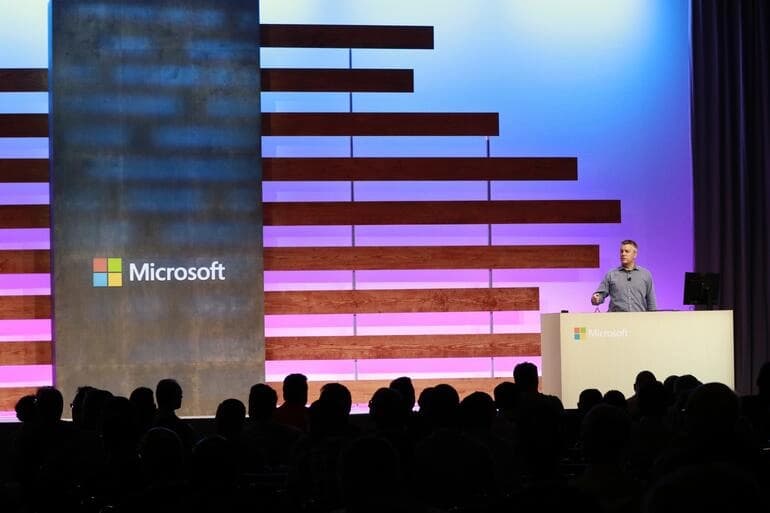
A group of college friends and I signed up for what we thought would be a fun weekend experiment. The 2019 Smart Infrastructure Hackathon at The Cannon in Houston, in partnership with Microsoft Azure, asked teams to build solutions for improving US city infrastructure. We had 24 hours, coffee, and a room full of cloud solution architects when we got stuck.
Our Idea
After kicking around a few concepts, we landed on road potholes. They cost American drivers $6.4 billion per year in repairs and insurance. Fixing one runs about $30–$50; letting it sit can cost a driver closer to $300 a year. The math made it worth building for.
Our pitch was a two-layer detection system:
- Layer 1: Dashcam footage analyzed in real time with computer vision
- Layer 2: Phone telemetry to confirm abrupt movement on the road
Confirmed potholes would plot on a map for cities to act on. The driver UI would stay minimal: a quick confirmation prompt, nothing that pulls attention off the road.
How We Built It
Python on Microsoft Azure, end to end. Four moving parts:
1. Mobile telemetry
On Android, we used a publicly available sensor logging app with developer-friendly CSV export. While driving test routes, it recorded GPS coordinates, accelerometer readings on all three axes, and timestamps. Same raw device data you'd get from developer tooling, just packaged for quick export off the phone.
In Python, pandas ingested those CSVs and matplotlib helped us spot patterns. The main challenge was false positives: not every jolt is a pothole. Plotting accelerometer readings over time let us tune the threshold before sending a hit downstream.
Pythonimport pandas as pd
import matplotlib.pyplot as plt

df = pd.read_csv('/home/br/Downloads/testdata.csv')
df['Time'] = pd.to_datetime(df.Time, format='%Y-%m-%d %H:%M:%S:%f')

columns = [
  'ACCELEROMETER X (m/s²)',
  'ACCELEROMETER Y (m/s²)',
  'ACCELEROMETER Z (m/s²)',
  'Time'
]

df[columns].plot(x='Time')
plt.show()
2. Live computer vision
This was the harder layer, and where the Azure architects helped most.
The idea was straightforward: mount a phone on the dash, record the road ahead, and let a vision model look for pothole-shaped disruptions in the pavement. Azure Logic Apps watched for incoming frames and pushed them into the cloud. From there, OpenCV handled basic preprocessing (cropping the road surface, normalizing lighting) before handing images off to Azure Computer Vision for analysis.
In a full production version, each frame would get scored for surface anomalies. A high-confidence visual hit plus a matching accelerometer spike from Layer 2 would trigger the confirmation prompt. Either signal alone might be noise; together they made the detection feel much more reliable.
We didn't get the whole pipeline polished in 24 hours, but we proved the concept: frames in, analysis out, tied back to what the phone sensors were already seeing.
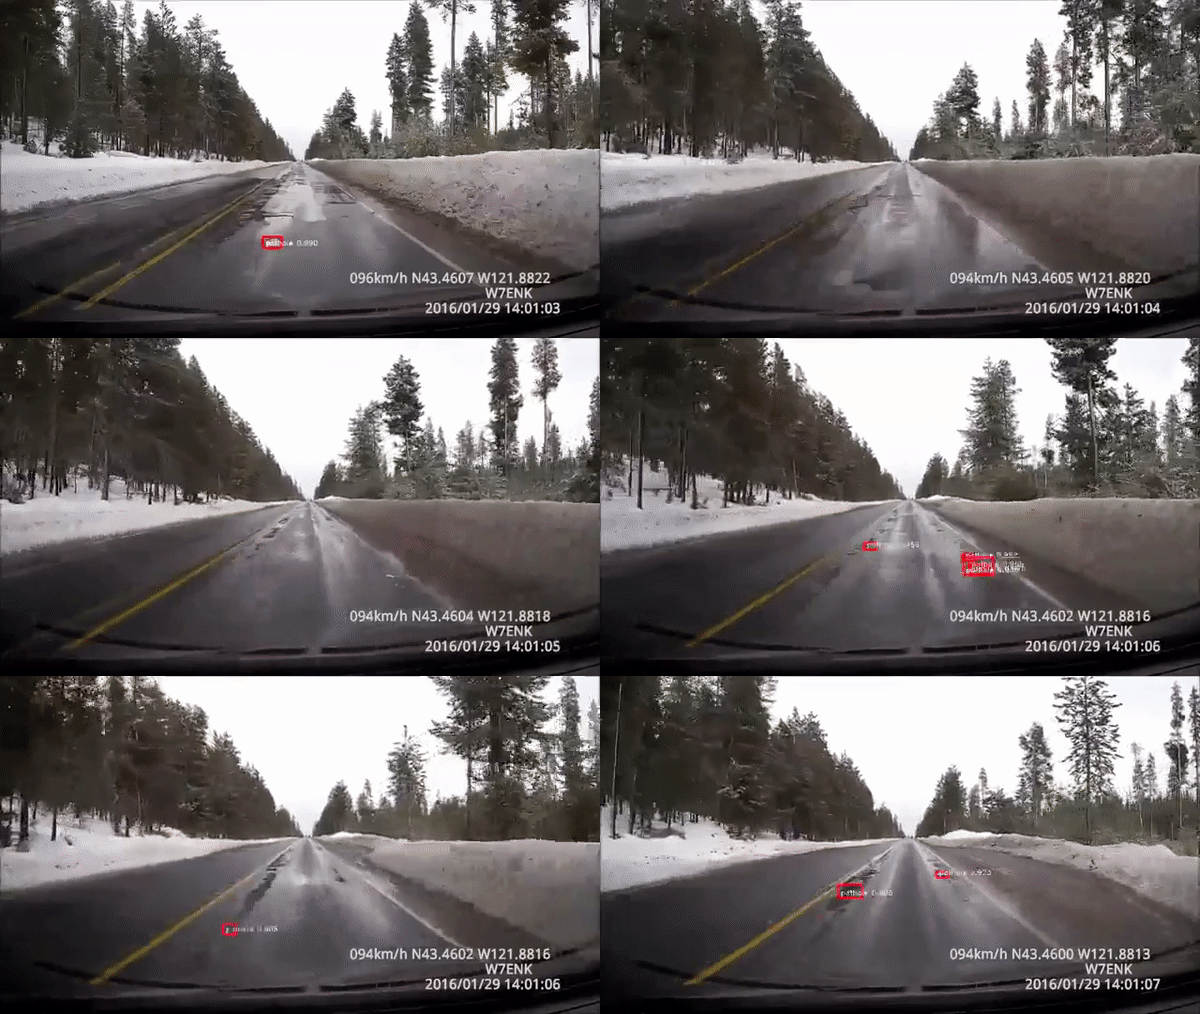
Dashcam footage concept: live capture and pothole prediction on the road.
3. The Interface
One job: show a dialog when the system flagged a pothole, let the driver confirm or dismiss. We ran out of time to wire up both backend and frontend, but I mocked up the intent: minimal, glanceable, and safe while driving.
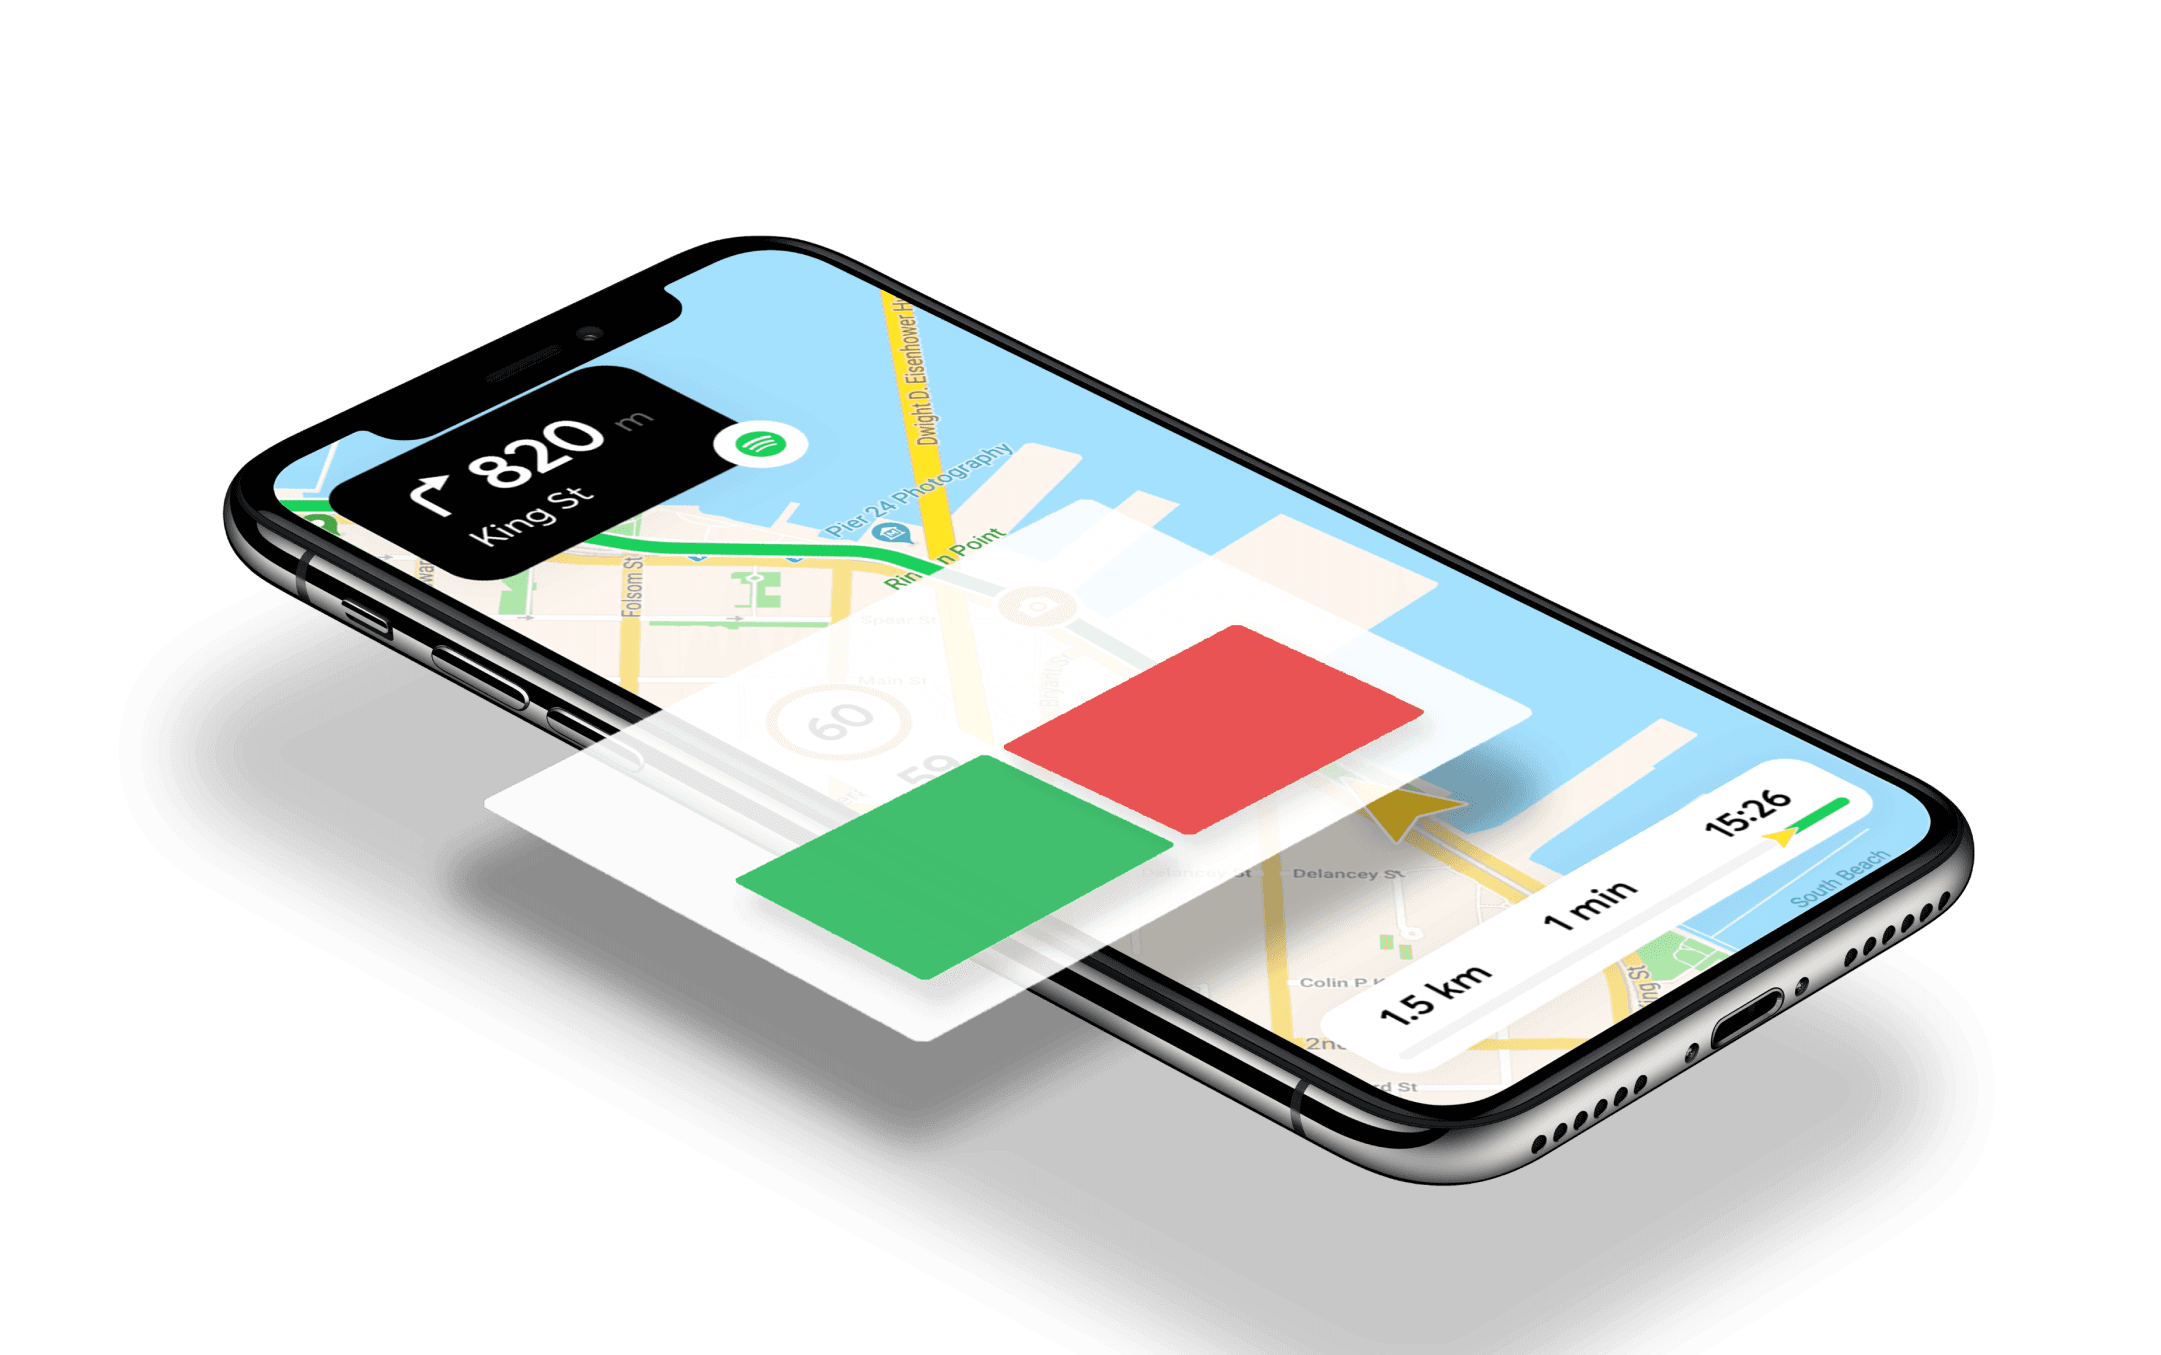
A simple pop-up to confirm a pothole, designed to keep the driver's attention on the road.
4. Mapping
For the backend, accurate geolocation was non-negotiable. A pothole report is only useful if a city crew can find it, and over a 24-hour hackathon we were collecting instances fast. Every confirmed hit needed a precise latitude, longitude, and timestamp so we could store it, deduplicate it, and eventually hand cities something actionable.
That is where clustering came in. One driver hitting the same rough patch might trigger a single spike. Several drivers reporting near the same coordinates over a few days starts to look like a real pothole. The backend grouped those nearby instances together instead of flooding the map with duplicate pins.
Folium handled the display layer: plot the collection of confirmed reports, cluster what overlaps, and give a quick visual read of where problems were stacking up. For the demo, that was enough to show how a city could prioritize repairs from crowdsourced data rather than waiting on manual inspection routes.
Pythonimport folium
import pandas as pd

SF_COORDINATES = (37.76, -122.45)
map = folium.Map(location=SF_COORDINATES)

for each in df.iterrows():
  map.simple_marker(
    location = [each[1]['Y'],each[1]['X']],
    clustered_marker = True
  )

display(map)
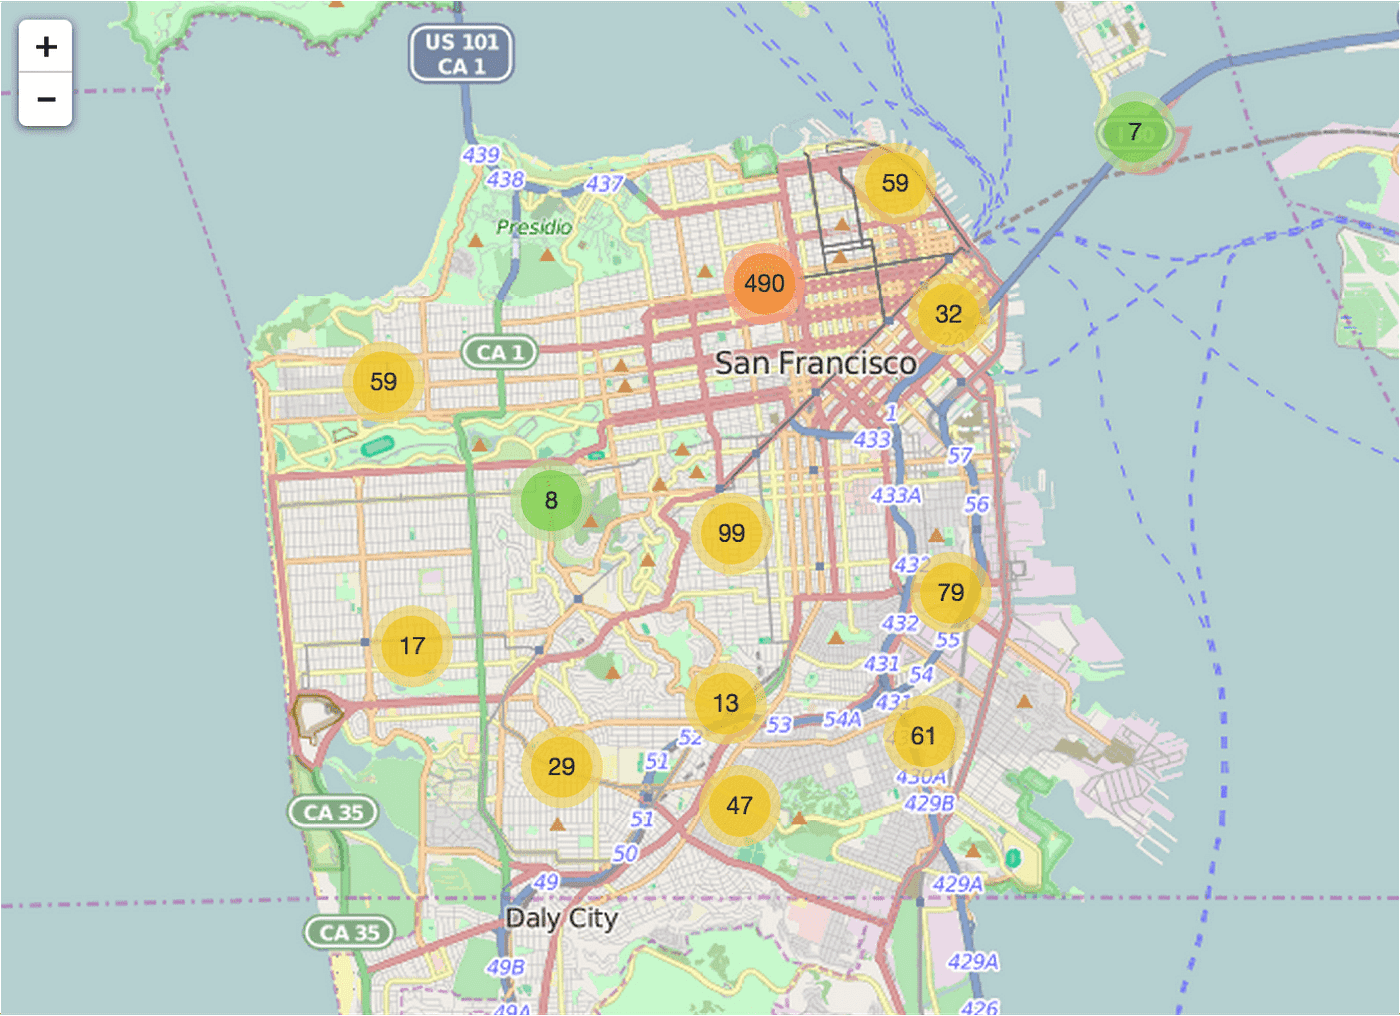
Potholes marked on a map of San Francisco. Clustered markers group nearby reports into a single signal instead of scattered one-off pins.
The Final Result
When the countdown ended, we had enough working to demo the full loop in 24 hours, thanks to strong team collaboration and a lot of help from the Azure architecture team. The judges called a draw for first place, and we walked away with Azure credits and seats at the host company's co-working space to keep building.
Looking back, it was such a fun little challenge. Twenty-four hours is barely enough time to sleep, let alone wire up computer vision, sensor pipelines, and a map backend. But that constraint is part of what made it exciting. A small group of people with different skills can sit down, pick a real problem worth solving, and actually start building toward something that could matter outside the room. Potholes are boring until you put a dollar figure on them and realize cities need better data to fix them. That is what I remember most.